Application of Kriging
The most complex section of the HRS model was integrating the kriging interpolation technique within a Matlab script. This involved creating a variogram – a function describing the degree of spatial dependence – for every time step.
|
Creating a Variogram
The initial stage in the creation of a variogram involves sorting data into relevant bins. Each bin represents a range of geographic distance between Met stations. The geographical distance was calculated with the use of Vincenty’s Formula (Vincenty, 1975) which is a widely used method and accurate to 0.5mm. Variogram value is calculated based on the following equation:
|
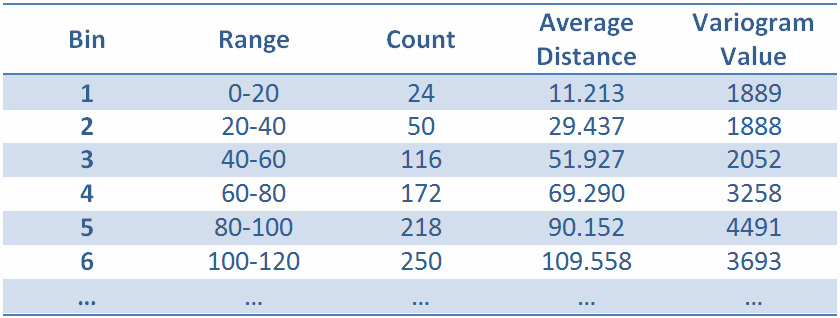
Figure 1: Example Variogram Table
|
where: gamma(h) is the variogram value, N(h) is the number of pairs of met stations (the count column shown in Figure 1), Z(x+h) is the global solar radiation at location 2 and Z(x) is the global solar radiation at location 1.
Following the creation of the variogram table the average distance, also known as the lag distance, and variogram value columns are plot against each other (blue points). In turn a curve fitting process is initialised to obtain an equation that relates all met stations to one another (red line) as shown in Figure 2.
Following the creation of the variogram table the average distance, also known as the lag distance, and variogram value columns are plot against each other (blue points). In turn a curve fitting process is initialised to obtain an equation that relates all met stations to one another (red line) as shown in Figure 2.
|
Using the Variogram To obtain a global solar radiation value at a specific location an N by N matrix of geographical distance between met stations needs to be generated. These geographical distances in turn will be used in conjunction with the variogram equation to obtain a matrix of variogram values (F-matrix). The next step involves generating an N by 1 matrix of geographical distances between an output point (selected location) and all met stations. As with the F-matrix, these geographical distances will be used to create a matrix of corresponding variogram values (C-Matrix). |
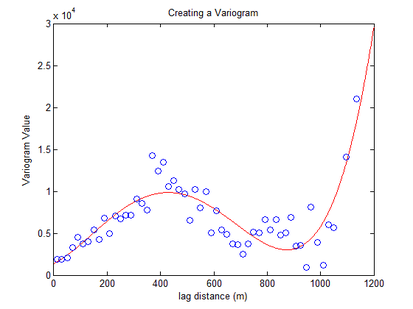
Figure 2: Variogram Plot
|
Both of these matrices are in turn used to calculate the N by 1 weighting of each met station matrix:
Weight = inv(F)*C
Thereafter the weight is applied to the global solar radiation value of each met station to achieve the global solar radiation value at that specific location.
Graham Cairns
University of Edinburgh, 2013
University of Edinburgh, 2013
